The figure below, from a 2015 paper by Trevor Bedford and his colleagues [1], shows the movement of influenza around the world :
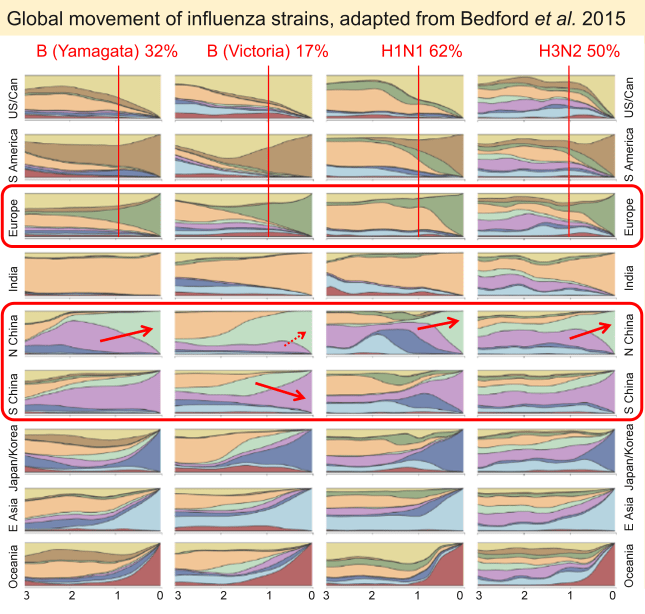
This figure takes a bit of explaining. The authors have divided the world into 9 regions, and, by analyzing the sequences of viruses that were sampled worldwide over three years, they charted the movement of influenza. The region where each virus was sampled is color coded, and the colors show where the ancestors of current viruses (in each region) came from as you go back in time. The numbers at the bottom show years before arrival of the strain in the region under consideration. The right-hand side of each box is only colored with the region’s own color because strains have had no time to move. As you go to the left the colors show where the ancestral viruses were at the time indicated. For example, “Yamagata-like” influenza B viruses in India (fourth row, first column) moved very little during the study, with almost all viruses at the end being descended from strains that were also in India at earlier times. At the other extreme (bottom right box), almost all H3N2 influenza in Australia had come into the country during the previous year.
This figure shows some interesting trends. For example, we can see that influenza tends to go from hotter countries to colder ones. For example, a lot of European strains came from India and other hot countries: 32% of Yamagata-like influenza B strains, 17% of Victoria-like B strains, 62% of H3N2 influenza A strains, and 50% of H1N1 A strains that were present in Europe at the end of the study came from strains that were in tropical or subtropical regions one year earlier. You can also see that in three out of four cases, more strains move from South China to North China than in the opposite direction (indicated by red arrows). The flow is not in one direction only, however. European and US strains can also make their way to South China and India, although movement in this direction is less common.
I have suggested that we need a rethink to explain the seasonality of respiratory viruses. I believe that seasonality is a side-effect of the natural temperature-sensitivity of virtually all respiratory viruses. However the viruses that exist in tropical regions would need to be less temperature-sensitive in order to replicate, because ambient temperatures are higher there, and people’s noses and throats are therefore warmer. This suggests that a virus that moved from the Tropics to the temperate regions would show greater virulence, because the cold air encountered there would make it more active. So the observation that respiratory viruses tend to move from south to north in the Northern Hemisphere would be predicted by this proposal.
However viruses do also move in the other direction, and they seem to adapt to their new climate in both cases quite quickly. If we assume that it takes two or three months for the virus to adapt, we can explain the seasonality of respiratory viruses, because ambient temperature in temperate regions changes significantly on that timescale. At the same time we can understand their presence throughout the year in the Tropics because they can adapt to the higher temperatures there in a few months.
[1] Bedford, Trevor, et al. “Global circulation patterns of seasonal influenza viruses vary with antigenic drift.” Nature 523.7559 (2015): 217-220.

One thought on “Patterns of global influenza movement”