-
-
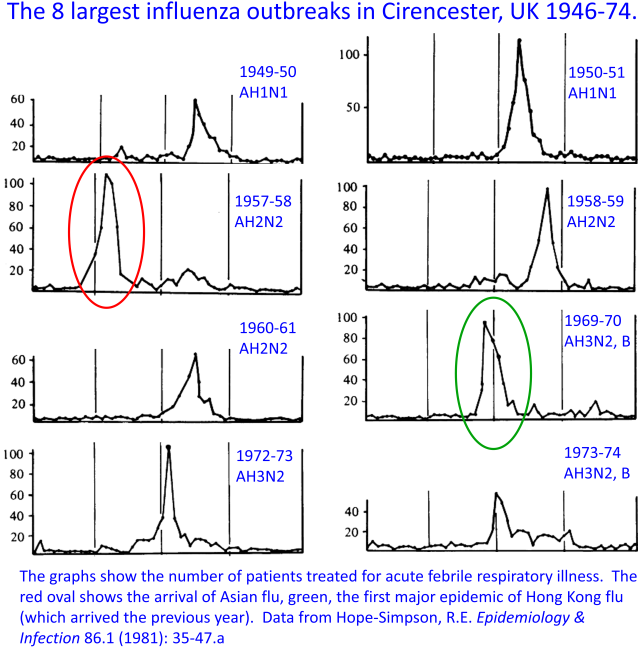
- The 8 major flu epidemics in the UK from 1946 – 1974 arrived very rapidly, then ceased within 3 – 5 weeks.
- Many susceptible individuals remained in the population, so the rapid ending of the epidemics is unexplained.
- Around 50% of influenza cases in New York City were recently shown** to be asymptomatic.
- It seems likely that new flu strains arrive in the community unnoticed, and are later activated by temperature drops.
-
The timing and duration of influenza epidemics seems to be a neglected topic – probably because the data doesn’t fit well with models of how epidemics ought to work.
The figure below shows the development of the 8 largest influenza epidemics in Cirencester, a community of about 3,700 people in the UK, between 1946 and 1974. The data were compiled by Edgar Hope-Simpson, who was a full-time GP in that town. He had a passion for virology, and became well-known for showing that shingles was caused by the reactivation of the chickenpox virus in the Island of Yell in Shetland. In Cirencester, he set up his own well-funded laboratory, where he was able to keep meticulous records of the viral strains that were responsible for the bouts of colds and flu that he saw in his medical practice.

It’s immediately clear from looking at these graphs that nothing like the SIR models (which we’ve become used to in the current Covid-19 epidemic) can describe the progress of these epidemics. The disease arrives, then goes away, with extraordinary speed. In most cases it reached a peak within three weeks, then disappeared in roughly the same period. As Hope-Simpson pointed out, the rapid disappearance was the strangest feature. For example, Asian flu arrived suddenly in Cirencester at the end of September 1957 (red oval). This was a completely new version of the virus that had new subtypes of both hemagglutinin (H) and neuraminidase (N), so we can assume that there was little immunity in the community. This lack of immunity was in fact confirmed by the arrival of a second, smaller epidemic after Christmas that year. So why did the first (red) epidemic cease?
Before we discuss this, look at the next figure below, which shows respiratory illnesses (caused by unknown viruses) during the winter of 1925-26 in the Netherlands. This figure was compiled and published by J.J. van Loghem, who was a Professor of Hygiene at the University of Amsterdam. The dotted and dashed black-and-white lines show van Loghem’s record of the percentage of the population in different regions that had a cold or influenza-like-illness each week. The colored lines (added by me) show the ambient temperatures recorded at five Dutch weather stations during the same period. I’ve plotted the temperatures upside-down, with low temperatures at the top of the graph, and high temperatures lower down, in order to make the trends clear.

Two points jump out: (1) there’s an extraordinary correlation between inverted temperature and respiratory illness, especially in the first half of the cold season. (2) Low temperatures don’t act by increasing transmission, because the spread of illness is far too rapid: within about two weeks after each temperature dip (rise on the graph), colds and flu develop all over the country, with no evidence of waves of illness that move around the country.
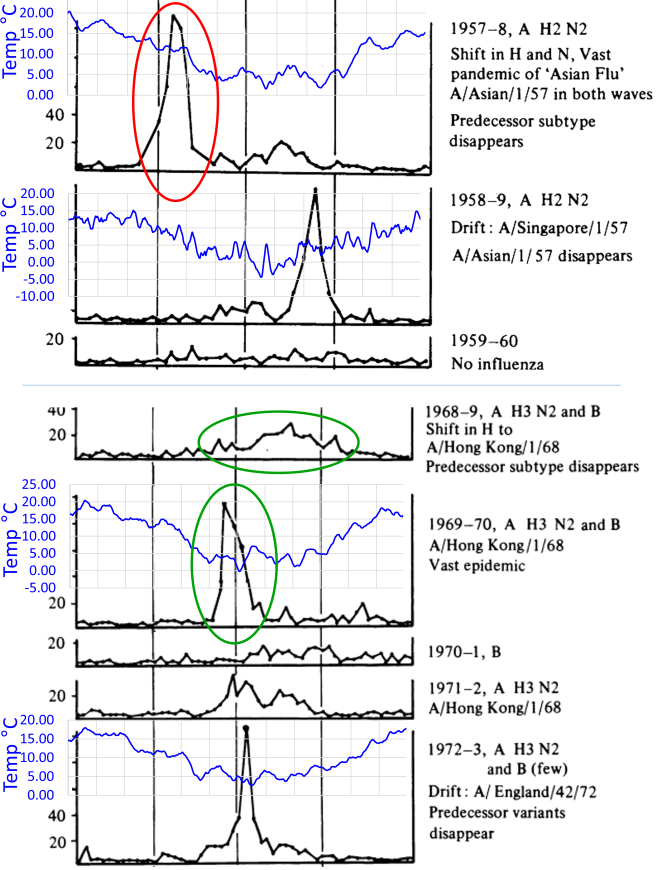
How can we make sense of these patterns? It seems clear from the Dutch data is that a “harvesting” mechanism is operating, where the illness spreads silently at first, but is then activated by temperature drops, and in this blog I am suggesting that the biochemistry of the virus is itself sensitive to temperature, with lower temperatures activating the virus. We know from recent studies in New York City** that roughly 50% of individuals carrying detectable influenza virus show no symptoms at all. It seems likely that a similar phenomenon was acting in colds and flu epidemics in the Netherlands. The virus was spreading asymptomatically, and therefore unnoticed, in the weeks and months leading up to each epidemic. Later, when the temperature dropped to a particular level, the viruses that many individuals all over the country who were harboring were activated simultaneously, and the epidemic became visible. A similar mechanism seems to have been at work in Cirencester: the flu virus arrived unseen at first, then, when temperature dropped, acute illness was triggered. Once that batch of cases were resolved, the temperature bottomed out, and no further (observable) cases were set off, so the epidemic ended. In the figure below I’ve added temperature to the first two epidemics generated by each of the two pandemics (novel strains) that arrived during the period. These were Asian flu (red oval) and Hong Kong flu (green oval). You can see the temperature drops that might have triggered these epidemics. (It would be interesting to add wind and rain to the graphs, because we know that these factors are correlated with colds and flu epidemics in the Tropics.)

Bear in mind that influenza strains move around the world quite rapidly, with a significant number of strains that originated in hot climates arriving in Europe and the USA every year~~. These strains all have different histories, so are, we might assume, adapted to different climates. Each strain is therefore likely to have a different degree of natural temperature-sensitivity. For example, it seems likely that Asian flu was less temperature-sensitive than most well-established flu strains, because feverish illnesses were triggered by a modest fall in temperature much earlier in the year than is typical for flu.
There’s a lot of other evidence, both from lab-work and hospital observations of epidemics, that this mechanism (referred to in this blog as the“temperature-dependent viral tropism” hypothesis, or M4) is the main driver of the winter seasonality of virtually all respiratory viruses. (Recent evidence suggests that changes to our immune defenses when we’re chilled – what I call M3 – also play an important role). Covid-19 clearly doesn’t spread as influenza does, but it’s a respiratory illness, and we’d like to know how much it has in common with flu and other well-established “seasonal” resp-viruses. It’s going to be much more difficult to collect meaningful data on CoV-2 to predict either its seasonality or its pathogenicity without a fundamental understanding of the factors that determine other viruses’ activity and the tissues that they infect.
For more information and discussion, click on the links below.
**The New York City study was published last year by Jeff Shaman and his colleagues: Galanti, M., et al. “Rates of asymptomatic respiratory virus infection across age groups.” Epidemiology & Infection 147 (2019).
~~Data showing the movements of influenza strains around the world was published in 2015: Bedford, Trevor, et al. “Global circulation patterns of seasonal influenza viruses vary with antigenic drift.” Nature 523.7559 (2015): 217-220. See also my annotation of their figure here.
_____________________________________________________
The TDVT Hypothesis
The temperature-dependent viral tropism (TDVT) hypothesis for respiratory viruses, referred to in my review as M4, is very simple:
-
-
- Viruses refrain from multiplying as fast as they can in order to spread themselves more widely (scientists call this the “trade-off” model)
- Respiratory viruses do this in a very simple way: they sense temperature. They refrain from developing at normal body temperature, and this allows them to keep out of the lungs, heart, brain etc. They normally replicate only in the cooler nose and throat, so the host keeps moving around and spreading the virus
- The seasonal pattern of viruses is a consequence of this. As temperatures rise in the air and thus in the nose and throat, the virus tends not to replicate in any part of the body
-
For a lay-person’s brief summary of M4 / the TDVT hypothesis please see
https://oldwivesandvirologists.blog/a-conversation-with-my-friend-brian/
For detailed scientific information about respiratory viruses, including discussion of the trade-off model, viral dormancy and much else, see my 2016 paper:
Also
Applications to Covid-19
Predicting the seasonality of Covid-19
-
-
- Seasonality of respiratory illness is not mainly driven by changes in the survival rate of viruses outside the body. If it were, respiratory illness would be rarer in the Tropics than in the summer in temperate regions.
- We need an explanation of seasonality that fits all the facts.
- Seasonality seems to be a side-effect the natural temperature-sensitivity of virtually all respiratory viruses
- CoV-2 may be less temperature-sensitive than typical respiratory viruses, therefore less seasonal
- Experiments are needed!
-
Epidemiology of respiratory illness
-
-
- Respiratory illness responds so quickly to changes in ambient temperature that conventional epidemiology can’t give a good description
- Data often show a “harvesting” mechanism, where temperature changes activate dormant colds and flu
- Colds and flu frequently appear in the rainy season in the Tropics
- Explanations based on increased transmission in cold, dry places can’t work in the Tropics!
-
Covid 19 and the trade-off model
-
-
- Evolution balances the benefits of virulence in parasites (greater rate of shedding) against the disadvantages (shedding for less time, and less dispersal)
- “Short-sighted selection” increases virulence. “Far-sighted selection” increases transmission.
- Viruses that jump to new hosts are sometimes extraordinarily virulent. Well-established viruses clearly moderate their virulence.
- The benefits of moderation will increase as we approach herd immunity.
- There can be a tipping point where less virulent strains begin to outcompete more virulent ones.
- We should track, trace and isolate ONLY the strains that give severe illness.
- Milder CoV-2 strains that are more temperature-sensitive may arise spontaneously in the next few weeks or months.
-
A simple model of CoV-2 transmission
-
-
- In institutions where transmission is frequent more virulent strains are favored
- Their longer incubation periods favor milder strains in the community
- Lockdown slightly increases the competitive advantage of milder strains
- We should be very careful to contain virulent strains that may arise in hospitals and other institutions where transmission can occur frequently
-
The adaptability of respiratory viruses
-
-
- Influenza tends to move from hotter countries to colder ones
- It seems to take a few months to adapt to a new climate
- CoV-2 replicated independently in the throat and lungs of a single patient
- The strain in the throat was derived from the lung one
- These observations give an indication of how rapidly respiratory viruses can adapt to new environments
- Experiments are needed ! !
-
Technical notes on CoV-2 for scientists
-
-
- We should focus on the temperature-sensitivity of RNA secondary structure
- The “s2m” structure in the 3’ untranslated region is of particular interest
- The distribution of ACE2 may not be the main driver of viral tropism
- Influenza has been shown to have a temperature-driven switch, with high temperature favoring transcription over replication
-
Suggestions for avoiding colds and flu – and Covid-19
-
-
- Observational studies can give us hints
- Never allow yourself to be chilled; dress warmly
- Take regular outdoor exercise, dressed warmly
- If you get a cold, stop exercise, avoid hot (and cold) drinks
- Stay warm!
-
One thought on “The strange arrivals – and departures – of influenza epidemics in the UK, 1946-1974”